A copy of this work was available on the public web and has been preserved in the Wayback Machine. The capture dates from 2017; you can also visit the original URL.
The file type is application/pdf.
Filters
Combining visual customer segmentation and response modeling
2013
Neural computing & applications (Print)
Preserved Fulltext
We provide a visual, data-driven and efficient framework for customer segmentation and campaign-response modeling. ...
Customer Relationship Management (CRM) is a central part of Business Intelligence, and sales campaigns are often used for improving customer relationships. ...
a review of time in SOMs). ...
doi:10.1007/s00521-013-1454-3
fatcat:xpajinchg5gkpjznhabg5mapni
Music Gesture for Visual Sound Separation
[article]
2020
arXiv
pre-print
Preserved Fulltext
A copy of this work was available on the public web and has been preserved in the Wayback Machine. The capture dates from 2020; you can also visit the original URL.
The file type is application/pdf.
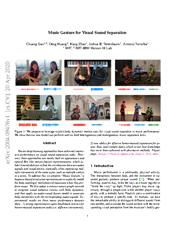
We first adopt a context-aware graph network to integrate visual semantic context with body dynamics, and then apply an audio-visual fusion model to associate body movements with the corresponding audio ...
points, especially when separating multiple instruments of the same types, such as multiple violins in a scene. ...
Since the real mix video data with multiple sounds on the MUSIC dataset do not have ground-truth labels for quantitative evaluation, we construct a synthetic testing set by mixing solo videos. ...
arXiv:2004.09476v1
fatcat:jl3ujfazkfgcncdfqqfaieebl4
Using space–time visual analytic methods for exploring the dynamics of ethnic groups' residential patterns
2010
International Journal of Geographical Information Science
Preserved Fulltext

A copy of this work was available on the public web and has been preserved in the Wayback Machine. The capture dates from 2017; you can also visit the original URL.
The file type is application/pdf.
In this alticle, we present a methodological framework, based on georeferenced houselevel socio-demographic and infrastructure data, for investigating minority (or ethnic) group residential pattern dynamics ...
The residential data were collected for over 40 years at four different moments, each associated with the population and housing censuses conducted by Israel's Central Bureau of Statistics and the Ministry ...
An alternative approach requires an introduction of geospatial coordinates of data elements directly into the SOM generation process, yielding mixed geospatial and multivariate SOM results (Bacao et al ...
doi:10.1080/13658816.2010.513982
fatcat:5rhnrvqmgfeo7dvaufblnwnchq
Text Mining in Qualitative Research
2008
Organizational Research Methods
Preserved Fulltext

A copy of this work was available on the public web and has been preserved in the Wayback Machine. The capture dates from 2020; you can also visit the original URL.
The file type is application/pdf.
The article provides an introduction to and a demonstration of the self-organizing map (SOM) method for organizational researchers interested in the use of qualitative data. ...
SOM creates multiple well-grounded perspectives on the data and thus improves the quality of the concepts and categories used in the analysis. ...
Type V
(rare)
Mixed Type I
Mixed Type II
Mixed Type III
Mixed Type VI
(rare)
Mixed Type IV
Pure
qualitative
Table 2 The 2 Characteristics of Two Knowledge Frameworks (KFs) That Were ...
doi:10.1177/1094428108317202
fatcat:puub5w3luzgjbaja2hv3l2nbfa
Integration of Cluster Analysis and Visualization Techniques for Visual Data Analysis
[chapter]
2003
Studies in Classification, Data Analysis, and Knowledge Organization
Preserved Fulltext
A copy of this work was available on the public web and has been preserved in the Wayback Machine. The capture dates from 2003; you can also visit the original URL.
The file type is application/pdf.
This Paper investigates the combination of numerical and visual exploration techniques focused on cluster analysis of multi-dimensional data. ...
We describe our new developed visualization approaches and selected clustering techniques along with major concepts of the integration and parameterization of these methods. ...
Furthermore hybrid measures have been integrated in order to handle data records with mixed scale types. ...
doi:10.1007/978-3-642-55721-7_14
fatcat:6xh7fxxxyre4jccsyngqnjvhp4
Cortex Inspired Learning to Recover Damaged Signal Modality with ReD-SOM Model
[article]
2023
arXiv
pre-print
Preserved Fulltext
A copy of this work was available on the public web and has been preserved in the Wayback Machine. The capture dates from 2023; you can also visit the original URL.
The file type is application/pdf.
This new approach not only improves the analysis of ambiguous data but also restores the intended signal! ...
The effect is remarkable both visually and quantitatively, specifically in presence of a significant degree of signal's distortion. ...
Nonetheless, some works mix supervised and unsupervised SOM learning to gather data of different nature. ...
arXiv:2307.15095v1
fatcat:a2hsm5a3urh3nb4to5wxqmemyu
An Integrated Condition Monitoring Method for Rotating Machinery Based on Optimum Healthy State
2022
Machines
Preserved Fulltext

A copy of this work was available on the public web and has been preserved in the Wayback Machine. The capture dates from 2022; you can also visit the original URL.
The file type is application/pdf.
Visualized fault diagnosis is carried out by the SOM when the health index exceeds the preset threshold. ...
Two cases with experiments are conducted to demonstrate the accuracy and robustness of the proposed method. ...
Data Availability Statement: Not applicable.
Conflicts of Interest: The authors declare no conflict of interest. ...
doi:10.3390/machines10111025
fatcat:llgnoc3o7ndenfycf6kbhhjdyq
Segmentation of Satellite Images Using Self-Organizing Maps
[chapter]
2010
Self-Organizing Maps
Preserved Fulltext

A copy of this work was available on the public web and has been preserved in the Wayback Machine. The capture dates from 2019; you can also visit the original URL.
The file type is application/pdf.
In this chapter, SOM based on a threshold technique and SOM cooperated with another method are tested on two different types of satellite images with different resolution. ...
SOM-HDGA performance can be improved using parallel cooperation with more segmentation methods such as Fuzy C-Means. ...
Since then, a number of theoretical and practical applications of SOMs have been reported including clustering, prediction, data representation, classification, visualization, etc. ...
doi:10.5772/9167
fatcat:qchsst7omzas3dvnvkpxtynnqe
Visual-Interactive Analysis With Self-Organizing Maps - Advances and Research Challenges
[chapter]
2010
Self-Organizing Maps
Preserved Fulltext

A copy of this work was available on the public web and has been preserved in the Wayback Machine. The capture dates from 2018; you can also visit the original URL.
The file type is application/pdf.
We argue that important improvements have been achieved which allow effective visual representation and interaction with the output of the SOM algorithm. ...
In this article, we review a selection of classic and more recent approaches to SOM-based visual analysis. ...
Acknowledgments We thank Tatiana von Landesberger, Juergen Bernard, Sebastian Bremm, and Joern Kohlhammer for fruitful discussion of SOM-based visual analysis methods. ...
doi:10.5772/9171
fatcat:f5u7iybdxjho7gvk2bj5hsh46e
Building-Level Urban Functional Area Identification Based on Multi-Attribute Aggregated Data from Cell Phones—A Method Combining Multidimensional Time Series with a SOM Neural Network
2022
ISPRS International Journal of Geo-Information
Preserved Fulltext
A copy of this work was available on the public web and has been preserved in the Wayback Machine. The capture dates from 2022; you can also visit the original URL.
The file type is application/pdf.
This paper uses Nanjing city as a test area, and a self-organizing map (SOM) neural network model based on an improved dynamic time warping (Ndim-DTW) distance is used to automatically identify the function ...
Furthermore, at the traffic analysis zone (TAZ) level, this paper detects that Nanjing has seven functional area hotspots with a high degree of mixing. ...
Conflicts of Interest: The authors declare no conflict of interest. ...
doi:10.3390/ijgi11020072
fatcat:3xdt4nvcbbe4jgoafecc7gxnhy
Self-organized classification of boundary layer meteorology and associated characteristics of air quality in Beijing
2018
Atmospheric Chemistry and Physics
Preserved Fulltext
A copy of this work was available on the public web and has been preserved in the Wayback Machine. The capture dates from 2018; you can also visit the original URL.
The file type is application/pdf.
Nine ABL types (i.e., SOM nodes) are obtained through the SOM classification technique, and each is characterized by distinct dynamic and thermodynamic conditions. ...
observed in Node 3 (a layer with strong stability in the upper ABL) rather than Node 9. ...
This study is supported by the National Key Research and Development Plan of China (no. 2017YFC0209606 and 2016YFC0203305), the National Natural Science Foundation ...
doi:10.5194/acp-18-6771-2018
fatcat:daawpaq7a5glld4hdniifdku5m
A hardware configurable self-organizing map for real-time color quantization
2016
2016 IEEE International Conference on Electronics, Circuits and Systems (ICECS)
Preserved Fulltext

A copy of this work was available on the public web and has been preserved in the Wayback Machine. The capture dates from 2020; you can also visit the original URL.
The file type is application/pdf.
The proposed reconfiguration allows to improve dynamically the PSNR of processed images by changing the structure of the SOM and its time is estimated to 38 clock cycles. ...
In this work, we propose a flexible and adaptable real-time hardware implementation of a SOM map applied to color quantization. ...
Therefore, a neuron receives via the NoC different types of messages: input data to process, processed data from other neurons of the SOM and configuration data. ...
doi:10.1109/icecs.2016.7841201
dblp:conf/icecsys/AbadiJKWB16
fatcat:fw4he5pe6zdxjpfba7ov7ap67q
Unveiling IoT Customer Behaviour: Segmentation and Insights for Enhanced IoT-CRM Strategies: A Real Case Study
2024
Sensors
Preserved Fulltext
A copy of this work was available on the public web and has been preserved in the Wayback Machine. The capture dates from 2024; you can also visit the original URL.
The file type is application/pdf.
In the first phase, we leverage the power of the self-organizing map (SOM) algorithm to segment IoT customers based on their connected device usage patterns. ...
This research is dedicated to understanding customer preferences in the context of the Internet of things (IoT) and employs a two-part modeling approach tailored to this digital era. ...
A self-organizing map (SOM) is like a special type of artificial neural network (ANN) that simplifies data into easy-to-understand maps. ...
doi:10.3390/s24041050
pmid:38400208
pmcid:PMC10892076
fatcat:2iiupq7zqfb6tpilzhhxxgehbu
COMPLEX-IT: A Case-Based Modeling and Scenario Simulation Platform for Social Inquiry
[article]
2020
arXiv
pre-print
Preserved Fulltext
A copy of this work was available on the public web and has been preserved in the Wayback Machine. The capture dates from 2020; you can also visit the original URL.
The file type is application/pdf.
COMPLEX-IT is a case-based, mixed-methods platform for social inquiry into complex data/systems, designed to increase non-expert access to the tools of computational social science (i.e., cluster analysis ...
, artificial intelligence, data visualization, data forecasting, and scenario simulation). ...
Finally, we would like to thank Carl Dister for his development support in the early stages of COMPLEX-IT. ...
arXiv:2003.03099v1
fatcat:smpsh73jzfcvxckuvobpnzr6cm
Exploring Patterns in Water Consumption by Clustering
2015
Procedia Engineering
Preserved Fulltext

A copy of this work was available on the public web and has been preserved in the Wayback Machine. The capture dates from 2017; you can also visit the original URL.
The file type is application/pdf.
We analyze water consumption data from a group of consumers at the Greek island of Skiathos, for which we have additional information about features concerning their water consumption patterns. ...
Results show that such analysis can be promising for the automatic classification of water consumers, based on urban water demand data, even if the data is not real-time, or even frequent, since consumptions ...
The authors also wish to acknowledge the Director of DEYASK, Mr. I. Sarris for his collaboration in providing us with data for this study. ...
doi:10.1016/j.proeng.2015.08.1004
fatcat:esjuv57a45dpzagudsoqa2orca
« Previous
Showing results 1 — 15 out of 8,357 results