Abstract
The broad applicability of super-resolution microscopy has been widely demonstrated in various areas and disciplines. The optimization and improvement of algorithms used in super-resolution microscopy are of great importance for achieving optimal quality of super-resolution imaging. In this review, we comprehensively discuss the computational methods in different types of super-resolution microscopy, including deconvolution microscopy, polarization-based super-resolution microscopy, structured illumination microscopy, image scanning microscopy, super-resolution optical fluctuation imaging microscopy, single-molecule localization microscopy, Bayesian super-resolution microscopy, stimulated emission depletion microscopy, and translation microscopy. The development of novel computational methods would greatly benefit super-resolution microscopy and lead to better resolution, improved accuracy, and faster image processing.
1 Introduction
The past few decades have testified to the rapid development of various super-resolution microscopy techniques (Ding et al., 2011; Gu et al., 2014; Gao et al., 2016; Yang et al., 2016a; Yu et al., 2016). Because the process of optical imaging is the convolution of the original object and the point spread function (PSF) of the system, the wave nature of light limits the resolution of conventional optical microscopy. Fortunately, the emergence of super-resolution microscopy has successfully broken the diffraction barrier and brought the spatial resolution of optical imaging down to nanometer scale. Super-resolution microscopy is therefore often termed ‘optical nanoscopy’. Quite a few super-resolution techniques largely rely on computational methods to further enhance the spatial resolution. For instance, deconvolution microscopy can effectively suppress the out-of-focus background and reconstruct the original object through deconvolution (Falk and Lauf, 2001). Fluorescence polarization microscopy (FPM) achieves super-resolution imaging by selective polarization modulation (Rizzo and Piston, 2005). Structured illumination microscopy (SIM) extends the optical transfer function (OTF) in the Fourier domain to enhance the spatial resolution (Gustafsson, 2000). Image scanning microscopy (ISM) replaces conventionally used photomultiplier tubes (PMT) detector with charge-coupled device (CCD), and achieves subdiffraction resolution through deconvolution (Müller and Enderlein, 2010). Super-resolution optical fluctuation imaging (SOFI) employs correlation analysis on the temporal fluctuation of the fluorescence to distinguish signals from independently fluctuating fluorophores (Dertinger et al., 2009). Consequently, the spatial resolution increases linearly with cumulant orders. Single-molecule localization microscopy (SMLM) can accurately localize individual molecules through sequentially switching them between fluorescently on and off states (Betzig et al., 2006; Rust et al., 2006). The achievable resolution of SMLM, e.g., PALM/STORM, can be down to 10–20 nm. As a result, computational methods in super-resolution microscopy are extremely important for achieving high-quality super-resolution imaging.
2 Deconvolution microscopy
Deconvolution microscopy is often used in fluorescence microscopy to remove the out-of-focus background. In an epifluorescence microscope, out-of-focus stacks are blurred, but their signals are still contributed to the detector, resulting in a strong background (Pawley, 2010). The microscopy imaging process could be described as I=O*H+B+N, where I is the detected image, O is the original image, H is the 3D PSF of the optical system, B is the offset from the image background and dark current from the detector, and N is the noise. Shot noise from the detector is a major source of noise, and its intensity is proportional to the square root of the signal level (Mertz, 2011). It is difficult to distinguish the signal from the background when the background is strong.
An intuitive way to remove the background is to solve the reverse problem in the Fourier domain, O=HTI/(HTH), but the denominator decays to zero for high frequency, indicating that it is an ill-posed problem. A practical solution is to use the Wiener filter:
where K is the noise power spectra (Gonzalez and Woods, 2008). This method is fast with reasonable accuracy and also works in problems without nonnegative constraints.
Statistical algorithms take into account the noise and solve the problem as a random process. The maximum likelihood estimation method, for example, uses the image that has the maximum likelihood of estimating the original object. A log-likelihood function is calculated and optimized with iteration (Broxton et al., 2013). Sometimes a penalty function can be added to ensure its convergence.
Constrained iterative algorithms use the constraint that the intensity of each pixel cannot be negative. An initial object function guess is provided. The value of each pixel is updated from the image formation equation on each iteration, and then negative values are set to zero. The Jansson Van-Cittert algorithm (Agard et al., 1989; Jansson, 2014) and the Gold algorithm (Gold, 1964) are two different approaches to updating the object function in each iteration.
Blind deconvolution algorithms assume that both the object and the PSF are unknown, and they use maximum likelihood estimate (MLE) estimation to obtain their approximation. An initial guess of the object and PSF must be provided. First, the object function is updated with the PSF, and then the PSF is updated with the new object function. This process is repeated interactively until a stop criterion is satisfied (Sibarita, 2005; Biggs, 2010; Yassif, 2012). The advantage of blind deconvolution is that the spatial distribution of the PSF of the system is not required, which is difficult or even impossible to obtain in some situations. However, this algorithm has the limitation of unstable and slow divergence.
There are also deconvolution methods applied for 2D images. For example, a variant of the nearest neighborhood method uses the 2D image itself as an estimation of the neighbor stacks. By iteration, it can also enhance the contrast of 2D images. These algorithms feature fast speed, but at the cost of efficiency.
Deconvolution microscopy has better performance for samples with low fluorescence density. Several factors limit its wider application: first, an accurate shift-invariant PSF can hardly be measured (McNally et al., 1999). Second, artifacts may be induced by the ill-conditional nature of the problems. Despite these constraints, deconvolution microscopy is still widely used as an economic solution to improve the resolution/contrast in both wide-field and confocal laser scanning microscopy, even in stimulated emission depletion (STED) super-resolution microscopy (Liu et al., 2012).
3 Polarization-based super-resolution microscopy
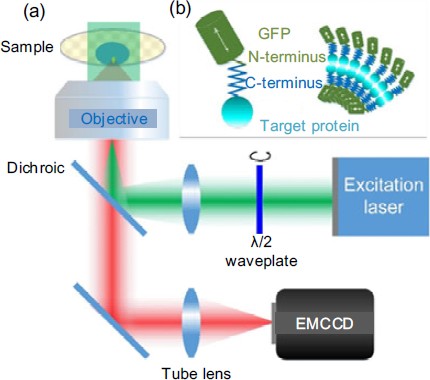
Polarization that arises from fluorescent dipole orientation is an important physical property in fluorescence. By polarization modulation of linear dichroism and analysis of fluorescence anisotropy, the fluorescent dipole orientation can be monitored so that the direction of targeted protein may be determined due to a restricted orientation between the fluorophores and their targets. Through specific fluorescent specimen binding to target molecules, fluorescence FPM plays an important role in resolving structural information and visualizing subcellular organelles (Axelrod, 1989; Vrabioiu and Mitchison, 2006; Lazar et al., 2011). Based on the same setup, using a wide-field epifluorescence illumination microscope (Fig. 1), three techniques differing in their computational method are demonstrated as follows.
Setup and principle of a wide-field epifluorescence illumination microscope
(a) The polarization of the excitation laser is continuously rotated by a half wave plate. Then, it is focused onto the back focal plane of the objective to generate uniform illumination with rotating polarization light. The fluorescent dipole is excited, and the fluorescence image is collected by an electron multiplying charge-coupled device (EMCCD) camera. As shown in the inset (b), the fluorescent molecule (such as green fluorescence protein, GFP) is linked to the target protein via C- and N-terminus. The dipole angle of the fluorophore reflects the orientation of the protein. Reprinted from Zhanghao et al. (2016), Copyright 2016, with permission from CC BY 4.0
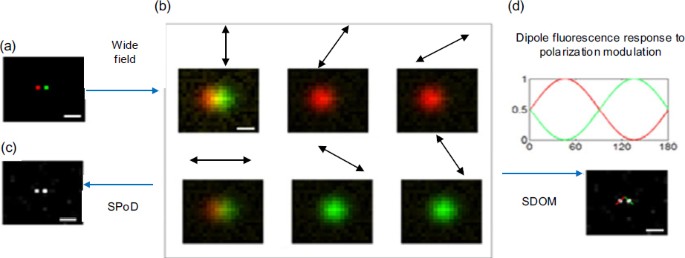
Under polarization illumination, the fluorescent molecules with inherent dipole orientations (Fig. 2a) emit periodic signals, which can be described by a cosine-squared function of the rotation angle. Wide-field images are obtained after the polarization modulation is blurred (Fig. 2b), and average dipole orientation is easily deciphered by employing a trigonometric function over the optical diffraction limit. Hafi et al. (2014) developed a novel super-resolution technique, super-resolution by polarization demodulation (SPoD), with polarization demodulation achieved by sparse deconvolution, to yield superresolution information from confocal images (Fig. 2c). Zhanghao et al. (2016) combined the advantage of super-resolution in SPoD with the dipole orientation in FPM and exploited a super-resolution dipole orientation mapping (SDOM) method to resolve effective dipole orientation within the subdiffraction focal area. The SDOM algorithm fully takes advantage of polarization modulation via sparsity-enhanced deconvolution to estimate the intensity signal and least-squares estimation to extract the effective dipole orientation at a subdiffraction scale (Fig. 2d).
Schematic of three techniques
(a) Two neighboring fluorescent dyes with different dipole orientations labeled in red and green emit periodic signals excited by rotating polarized light denoted by a double arrow. (b) FPM analyzes wide-field polarization modulation signals to decipher average dipole orientation over the optical diffraction limit. (c) Illustration of the SPoD principle. Super-resolution information is retrieved from confocal images by the SPEED algorithm. (d) The pipeline of SDOM. After SDOM reconstruction, the super-resolution image is obtained and the cosine curve is applied to fit the demodulated signal for every pixel to extract the orientation. Arrows indicate the direction of dipole orientation. Scale bar: 200 nm. References to color refer to the online version of this figure. Reprinted from Zhanghao et al. (2016), Copyright 2016, with permission from CC BY 4.0
We denote the polarization angle as α(t) at shift time t and the average orientation of pixel r as α0(r) at t=0. Then we have α(0)=0 and α0(r)∈[0, π]. The ith single molecule with orientation αi emits photons with an intensity Mif0(α(t)−αi), where Mi is the maximum number of photons emitted by the ith molecule and f0(α)=cos2α. Then n molecules at position or pixel r emit photons:
The first sum in Eq. (2) can be regarded as vector addition, so we obtain the following formula:
Orientational order imaging has made significant advances using polarized fluorescence via wide-field microscopy, and we use Fluorescence LC-PolScope (DeMay et al., 2011) as an example of FPM to present a method for analyzing the anisotropy of fluorescence. p ]Based on the observation whose fluorescence anisotropy is manifested in a sinusoidal variation, the photos I detected by the camera are depicted as a function of the polarization angle α0:
In Fluorescence LC-PolScope, the intensity is recorded at four specified polarizer angles, 0°, 45°, 90°, and 135°. For each pixel, the anisotropy is calculated using the following expressions:
Eq. (7) solves the average fluorescent dipole orientation over diffraction limit spatial resolution. The polarization ratio is applied to interpret the anisotropy of fluorophores within the diffraction-limited volume and their mutual alignment.
In SPoD, the time-dependent fluorescent emission recorded by EMCCD can be written as
where g(r, t) is the real average polarization modulation signal emitted by molecules at position r with time shift t. T corresponds to the period when the polarizer rotates by 180°. At each time point t, g(r, t) is blurred by the PSF U(r) of the microscope system, which can be mathematically expressed as a convolution process.
The cosine-squared function f(t)=cos2(πt/T) is used to depict the factor of the polarization angle in the process of observation. The unmodulated background b(r) is modeled as time-invariant within a short time. I0(t) is a time-dependent periodic correction factor for the dichroic mirrors and varies somewhat with the polarization angles. The detected image I(r, t) is hence subject to a Poisson distribution with parameter μ(r, t) at each r and t. In SPoD, f(t) is integrated, meaning that the difference of g(r, t) in the temporal dimension is eliminated, so the reconstructed g(r, t) loses the cosine function property, which is of great value in estimating the orientation of position r.
In SDOM, r′ and t′ are assumed to be related instead of independent in Eq. (8) to extract the dipole orientation of the molecules. The observation process is modified as follows:
where
Both SPoD and SDOM intend to estimate g(r, t). g(r, t) and \(\tilde b(r)\) are both independent and identically distributed, where \(\tilde b(r)\) is the cosine transform of b(r) to accelerate computations. Maximum a posteriori (MAP) is applied with
and the optimization model \(\underset{g,b}{\arg \min} \,L(g,b,I)\) is obtained, where \(L(g,b,I) = \int\nolimits_0^T {\int {(\mu - I\log \mu ){\rm{d}}r{\rm{d}}t + {\lambda_1}{{\left\vert g \right\vert}_1} + {\lambda_2}{{\left\vert {\tilde b} \right\vert}_1}{.}}}\) (12)
The fast iterative shrinkage-thresholding algorithm (Beck and Teboulle, 2009) is employed to achieve fast minimization and g(r, t) is recovered from I(r, t). The super-resolution image can be obtained by integrating g(r, t) with respect to t, which is equivalent for SPoD and SDOM.
Beyond super-resolution imaging, SDOM applies least-squares estimation (Eq. (3)) to fit the demodulated polarization intensity signals to extract the dipole orientation, which brings FPM down to super-resolution microscopy. In SDOM, effective dipole orientation within a super-resolved focal volume, as a new dimension, is superimposed onto the intensity super-resolution images to provide more refined insight, so that structural imaging can be reduced to nanometric scales. The orientation uniform factor (OUF=A/B, where A and B are the orientation amplitude and super-resolution translation, respectively) is defined to describe the confidence of local orientation distribution and a higher OUF means a result of fewer heterogeneous fluorescent molecules. SDOM exhibits higher OUF than FPM due to the much smaller number of fluorescent molecules with a subdiffraction area, which makes the orientation mapping more robust and accurate.
Table 1 shows a comparison among FPM, SPoD, and SDOM. Note that these techniques share the same instrumentation that the fluorescent intensities are collected with modulation of excitation polarization.
In conclusion, FPM is applicable to the analysis of orientational order and has been extensively studied for understanding biological organizations and functions. SDOM and SPoD use different imaging models. Though the sparsity-enhanced deconvolution used in SPoD is implemented as part of the SDOM algorithm, a combination of deconvolution and orientation mapping completes the SDOM algorithm. Only with both steps in the SDOM algorithm, can the polarization modulation information be fully used to obtain super-resolution images of intensity and dipole orientation.
4 Structured illumination microscopy
Whereas most super-resolution techniques, such as STED and PALM/STORM, achieve superresolution from modulations in the spatial domain, the principle of structured illumination microscopy (SIM) lies in the frequency domain (Gustafsson, 2000; Gustafsson et al., 2008; Dong et al., 2015; Yang et al., 2015; Lal et al., 2016; Zhou et al., 2016).
In SIM, the specimen is illuminated by the light of a structured pattern of intensity, and the pattern is typically a 1D sinusoidal function:
where r is the spatial position, Io is the peak illumination intensity, m is the modulation factor, pθ is the sinusoidal illumination frequency vector in the reciprocal space, and φ is the phase of the illumination pattern. Subscript θ indicates the orientation of the sinusoidal illumination pattern. Because the high frequency of the specimen is shifted back into the OTF of the optical system, which is similar to the Moiré interference, one can detect a super-resolution image using this approach.
The observed emission distribution through the optical system is
where S(r) denotes the fluorophore density of the specimen, H(r) is the PSF of the optical system, and N(r) is additive Gaussian (white) noise.
The Fourier transform of the observed image is given by
This equation suggests that the spectrum of the original image is replicated three times with the center on the origin, pθ, and −pθ. To separate these spectral components, at least three SIM images with different phase shifts are needed. Typically, φ1=0°, φ2=120°, and φ3=240°.
The ungraded approximations of these spectral components are obtained by Wiener filtering of their corresponding noisy estimates obtained by solving the above system of equations.
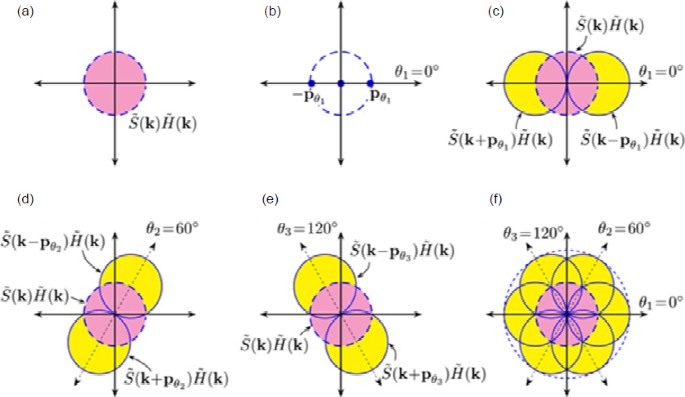
Repeating the process with different orientations of the illumination pattern enables computation of the frequency content of a circular region whose radius is twice the radius of the OTF (Fig. 3), which corresponds to a twofold resolution enhancement.
Image reconstruction principle of structured illumination microscopy
(a) Observable frequency content of a specimen in the reciprocal space is limited by optical system OTF, H(k). (b) Frequency content of a sinusoidally varying intensity pattern (vertical stripes, θ1=0°) relative to optical system OTF, (c, d, e) Observed frequency content of a structured illuminated specimen is a linear combination of frequency content within three circular regions. Note that frequency contents within crescent-shaped yellow regions are now observable due to the Moiré effect and may be analytically computed. By illuminating the specimen sequentially with a sinusoidally varying illumination pattern at three different angular orientations 0°, 60°, and 120°, the information of specimen’s frequency that is twice that limited by optical system OTF may be obtained. (f) Separately obtained frequency contents are eventually merged and subsequently used to construct a super-resolved image of the specimen. Reprinted from Lal et al. (2016), Copyright 2016, with permission from IEEE. References to color refer to the online version of this figure
Conventionally, 2D SIM employs the previously discussed 9-frame reconstruction; however, SIM reconstructions with a reduced number of raw images have been demonstrated (Orieux et al., 2012; Li et al., 2015).
5 Image scanning microscopy
Confocal fluorescence microscopy is popular among biologists for its superior sectioning ability. In confocal microscopy, a laser is usually used to focus on a detection point, and a pinhole before the detector is conjugated to this point. The point-by-point scanning process is realized by a piezo stage or galvanometer. Theoretically, confocal microscopy could enhance the optical resolution by a factor of \(\sqrt 2\). To achieve an acceptable signal level, however, a pinhole with a diameter of 1∼2 Airy units is usually used instead of an infinite small pinhole. Thus, the resolution enhancement is not significant compared to conventional epifluorescence microscopy.
Image scanning microscopy (ISM) (Müller and Enderlein, 2010; Sheppard et al., 2013) is an improved version of conventional confocal microscopy. ISM replaces the PMT pinhole with a CCD and by deconvolution, it could improve the resolution by a factor of 2. The image detected at position s on the CCD and at scanning position r in the sample can be given by
where U(r) is the wide-field detection PSF, E(r) is the excitation intensity density, and c(r) is the spatial density of fluorescence emitters. In the step involving the rearrangement of pixels, we use s=rd and r=rr−αrd, and integrate over rd:
where subscripts r and d denote the coordinates of the discrete data after scanning the sample.
When α=0, this intensity gives a wide-field image, and when α=1 it gives a nonconfocal scanning image. ISM requires α=0.5, and thus we have
That is, Ieff(rr)=c(rr)*Ueff(rr), where
Finally, the spectra of the effective PSF are broadened by a factor of 2, which is similar to structure illumination. A Wiener filter (Gonzalez and Woods, 2008) can be used for deconvolution \(\tilde w(k){I_{{\rm{eff}}}}(k)\), where
and \( \ni\) denotes a sufficiently small value.
The recent development of ISM includes spinning disk ISM and two-photon ISM. In spinning disk ISM, multiple focal points are scanned in parallel with the help of a microlens array, so the image speed can be significantly enhanced (Schulz et al., 2013). Two-photon ISM uses longer wavelength excitation for better sectioning ability (Ingaramo et al., 2014).
6 Super-resolution optical fluctuation imaging microscopy
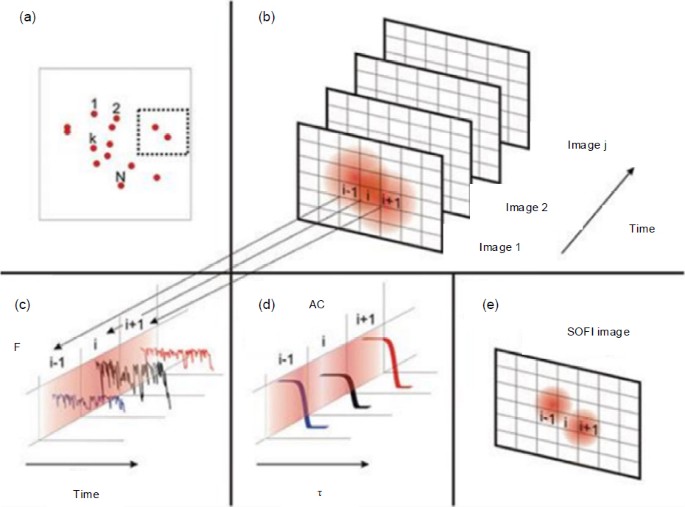
Super-resolution optical fluctuation imaging (SOFI) is a technically simple but practically useful technique to achieve super-resolution imaging through analyzing the inherent blinking statistics of fluorophores. Dertinger et al. (2009) first proposed the concept of SOFI and experimentally demonstrated SOFI imaging on cellular structures. The basic principle of SOFI reconstruction is based on temporal correlation of fluctuation signals. As shown in Fig. 4a, we assume a sample consisting of N independently fluctuating fluorophores. The fluorescence intensity at a given position r and time t can be expressed as
where U(r) represents the PSF of the system, εi the molecular brightness, and si(t) the fluorescence fluctuation of individual fluorophores.
Schematic of super-resolution optical fluctuation imaging (SOFI) reconstruction (Dertinger et al., 2009)
(a) A sample consisting of N individual fluctuating fluorophores; (b) Image sequence of two nearby fluorophores; (c) Time traces of individual pixels; (d) Temporal correlation functions of the extracted time traces; (e) SOFI-reconstructed image of two nearby fluorophores
Then, the 2nd-order autocorrelation function of the detected fluorescence fluctuation can be described as
In Fig 4b, the image sequence of two nearby fluorophores can be collected by a camera. As can be seen, the two fluorophores cannot be well distinguished in the collected images. The fluctuation traces of individual pixels can be extracted and are shown in Fig. 4c. Subsequently, through pixel-wise analysis of the temporal fluctuations using the correlation function, i.e., Eq. (22), the two nearby fluorophores can be better resolved in the SOFI image shown in Fig. 4e.
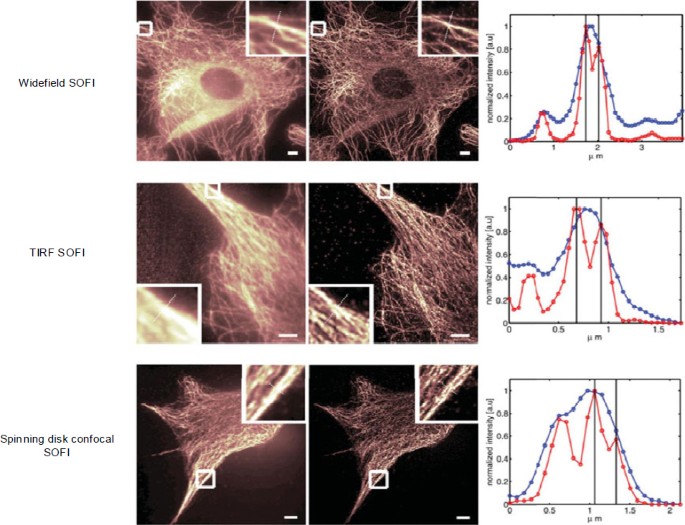
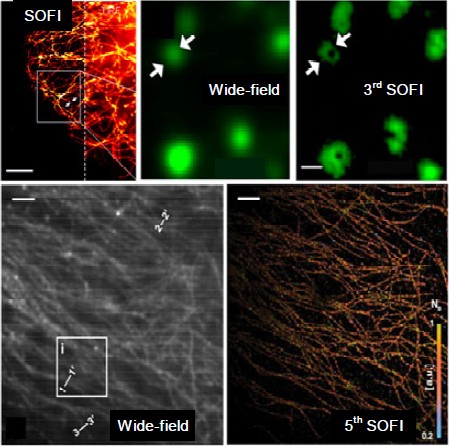
As shown in Fig. 5, the SOFI technique can be employed on various platforms, e.g., wide-field, total internal reflection fluorescence (TIRF), and spinning-disk confocal microscopes (Dertinger et al., 2013). Geissbuehler et al. (2012) proposed balanced SOFI (bSOFI) combining multiple SOFI orders to improve spatial resolution and alleviate reconstruction artifacts. Zeng et al. (2015) proposed joint tagging SOFI (JT-SOFI) to achieve fast, high-fidelity super-resolution imaging. In addition, Zhang et al. (2015) synthesized a monomeric switchable fluorescent protein called Skylan-S, featuring high brightness, photostability, and contrast ratio for live-cell SOFI (Fig. 6). Currently, the achievable lateral and axial resolutions for SOFI are ∼50 and ∼300 nm, respectively.
SOFI employed on different platforms, including wide-field, total internal reflection fluorescence (TIRF), and spinning-disk confocal microscopes
Reprinted from Dertinger et al. (2013), Copyright 2013, with permission from Cambridge University Press. References to color refer to the online version of this figure
7 Single-molecule localization microscopy
Single-molecule localization microscopy (SMLM) can achieve very high spatial resolution. (f)PALM/STORM is the typical technique for SMLM. In 2006, Eric Betzig, Samuel Hess, and Xiaowei Zhuang experimentally demonstrated the concept of (f)PALM/STORM (Betzig et al., 2006; Hess et al., 2006; Rust et al., 2006). In PALM/STORM imaging, through sequentially switching the on-off states of individual fluorophores, most of the fluorophores can be spatially isolated. Subsequently, the centers of isolated fluorophores can be determined by 2D Gaussian function fitting. The localization precision can be given by
where N represents the detected photon number, a is the effective pixel size of the detector, and b describes the background noise. As a result, increasing the detected photon number can significantly improve the localization precision. The final PALM/STORM image can be reconstructed by superimposing all the localized image frames, yielding a super-resolution image. The currently achievable lateral and axial resolutions for PALM/STORM are 10–20 and 50–60 nm, respectively.
8 Bayesian super-resolution microscopy
In localization techniques such as PALM/STORM (Betzig et al., 2006; Rust et al., 2006; Huang et al., 2010; Hao et al., 2013), the fluorescence emission from individual molecule fluorophores should be nonoverlapping. In certain frames, a limited number of fluorescence points can be localized; thus, PALM/STORM needs tens of thousands of frames of raw data or even more (Rust et al., 2006; Huang et al., 2010; Gao et al., 2016). Switching a large number of probes into a nonemitting state is required to achieve the nonoverlapping fluorophore emission necessary for normal localization microscopy analysis methods. Using a near-ultraviolet laser can cause a limited population of fluorophores to generate fluorophores. Also, relatively high intensity illumination (1–10 kW/cm2) at a single imaging wavelength can, under suitable chemical conditions, achieve conventional localization nanoscopy. Both near-ultraviolet and high-intensity illumination can damage the cells, which hindered the application of conventional localization nanoscopy in long-term live cell imaging. One new localization super-resolution model, the Bayesian analysis of blinking and bleaching (3B analysis) method, was used by Cox et al. (2012). 3B nanoscopy models the most likely distribution of molecule locations by studying the fluctuation/blinking and bleaching of the fluorophores in which these fluorophores are overlapping. Compared with PALM/STORM, 3B can allow multiple emitters within the focal volume in the ON state; statistical blinking can be employed constructively to generate the super-resolution image. The 3B method greatly reduces the number of raw data frames required to achieve one resolution-enhanced image. A temporal resolution of 4 frames/s with sub-50-nm resolution can be achieved during dynamic cell processes.
Because the 3B method requires heavy computation to reconstruct a large number of ‘molecules’ from a relatively small image dataset, cloud computing holds the potential to increase the speed of 3B microscopy single-molecule localization and reconstruction (Hu et al., 2013a). Considering the advantage of low phototoxicity and high spatiotemporal resolution, both spatial organization and temporal dynamics of Pol II clusters were observed with Bayesian nanoscopy by Chen et al. (2016). Also, Yang et al. (2016b) performed a 3B subdiffraction imaging measurement (300 frames) of a microtubule sample in a HeLa cell labeled with quantum dots. Furthermore, to enhance the signal-to-noise ratio (SNR) of single-molecule events in one frame, light sheet illumination was employed to enhance the SNR for single-molecule super-resolution imaging in the nucleus. A prism-coupled light sheet Bayesian microscope (Hu et al., 2013b) was set up to render deep-cell subdiffraction imaging of heterochromatin in live embryonic stem cells of a human.
9 Stimulated emission depletion microscopy
Stimulated emission depletion (STED) theoretically achieves diffraction-unlimited super-resolution imaging by virtue of stimulated emission. Hell and Wichmann (1994) proposed the concept of STED fluorescence microscopy. Subsequently, STED was first experimentally demonstrated by Klar et al. (2000). In theory, STED can reconstruct superresolution images without the requirement of additional postprocessing. However, in practice, owing to the noise and image distortions during image acquisition, additional image processing algorithms, e.g., deconvolution and denoising, are usually incorporated to further enhance the spatial resolution and contrast of reconstructed images. In commercial STED microscopes, the Huygens STED deconvolution method is commonly employed as the image postprocessing method (Schoonderwoert et al., 2013). Huygens deconvolution can perform nonlinear iterative deconvolutions on STED raw image data, improving both the spatial resolution and SNR of super-resolution images. The Huygens deconvolution algorithm makes a comparison between the measured image and the estimate of the image, which is the convolution between the estimate of the object and the PSF. Subsequently, the algorithm computes a correction image and the quality measure. After iteratively applying the correction image, the algorithm stops if sufficient quality is reached. As a consequence, the STED deconvolved images present better spatial resolution and contrast compared to their confocal and the conventional STED counterparts.
10 Translation microscopy
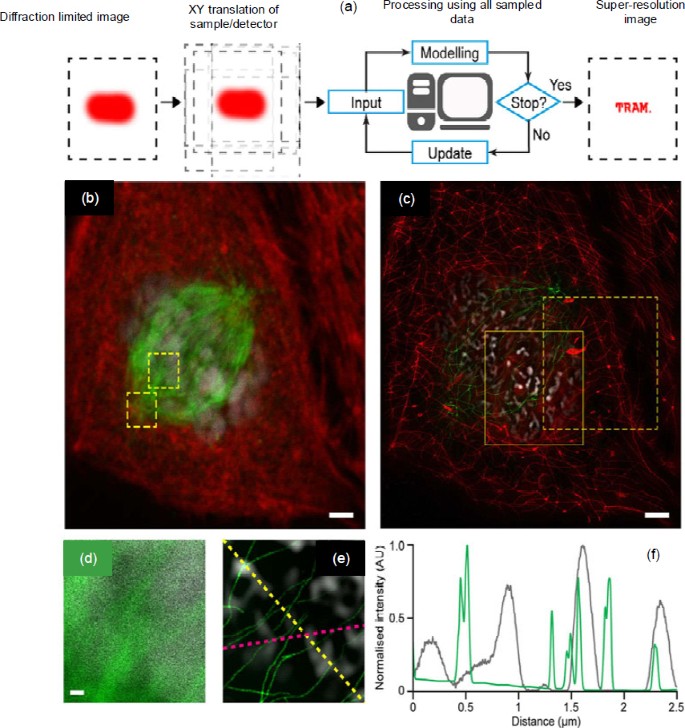
Recently, Qiu et al. (2016) presented a novel and technically simple way of achieving super-resolution microscopy, called ‘translation microscopy (TRAM)’. TRAM obtains a super-resolution image through simply translating the specimen/detector during image acquisition. A high-resolution (HR) image can be calculated from a series of low-resolution (LR) images that are translated with one another in the X-Y plane. In theory, TRAM tries to solve an inverse problem by minimizing an energy function. The minimization problem was solved by an iteratively reweighted least-squares (IRLS) method. When the HR image estimations between two adjacent iterations present negligible differences, the iteration stops and the result is regarded as the restored superresolution image. As shown in Fig. 7, the TRAM-restored images exhibit significant background rejection and resolution enhancement. TRAM can achieve up to 7-fold resolution improvement compared to conventional diffraction-limited microscopy. One of the advantages of TRAM is that it can be adapted to most types of conventional microscopes with little or no hardware modification, making TRAM accessible to virtually any laboratory with a conventional microscope configuration.
Principle and applications of translation microscopy
(a) Illustration of translation microscopy (TRAM); (b) Diffraction-limited image of a cell sample staining actin, microtubules, and nuclei; (c) TRAM-restored image using 60 translational diffraction-limited images; (d) Magnified region of microtubules and DAPI-stained nuclei in (b); (e) TRAM-restored image of the same region in (d); (f) Intensity profiles of the microtubules (yellow line) and DAPI (pink line) in (e). Reprinted from Qiu et al. (2016), Copyright 2016, with permission from CC BY 4.0. References to color refer to the online version of this figure
11 Conclusions
Super-resolution microscopy is achieved through physical and chemical changes of fluorescent molecules and heavily relies on the computation methods. In this work, we reviewed several popular superresolution techniques in which advanced computational techniques are embedded. A tabular comparison of different super-resolution microscopy techniques is presented in Table 2. We hope that this review can serve as a bridge to connect the superresolution microscopy community and the computation community so that novel computational techniques can be applied toward better resolution, improved accuracy, and faster image processing. The currently developed super-resolution techniques may also benefit the computational image processing techniques in their respective applications, when the image data shares a similar digital nature through current or modified instrumentation.
References
Agard, D.A., Hiraoka, Y., Sedat, J.W., 1989. Threedimensional microscopy: image processing for high resolution subcellular imaging. 33rd Annual Technical Symp., p.24–30. https://doi.org/10.1117/12.962684
Axelrod, D., 1989. Fluorescence polarization microscopy. Methods Cell Biol., 30:333–352. https://doi.org/10.1016/S0091-679X(08)60985-1
Beck, A., Teboulle, M., 2009. A fast iterative shrinkagethresholding algorithm for linear inverse problems. SIAM J. Imag. Sci., 2(1):183–202. https://doi.org/10.1137/080716542
Betzig, E., Patterson, G.H., Sougrat, R., et al., 2006. Imaging intracellular fluorescent proteins at nanometer resolution. Science, 313(5793):1642–1645. https://doi.org/10.1126/science.1127344
Biggs, D.S., 2010. 3D deconvolution microscopy. Curr. Protoc. Cytom., 52:12.19.1-12.19.20. https://doi.org/10.1002/0471142956.cy1219s52
Broxton, M., Grosenick, L., Yang, S., et al., 2013. Wave optics theory and 3-D deconvolution for the light field microscope. Opt. Expr., 21(21):25418–25439. https://doi.org/10.1364/OE.21.025418
Chen, X., Wei, M., Zheng, M.M., et al., 2016. Study of RNA polymerase II clustering inside live-cell nuclei using Bayesian nanoscopy. ACS Nano, 10(2):2447–2454. https://doi.org/10.1021/acsnano.5b07257
Cox, S., Rosten, E., Monypenny, J., et al., 2012. Bayesian localization microscopy reveals nanoscale podosome dynamics. Nat. Methods, 9(2):195–200. https://doi.org/10.1038/nmeth.1812
DeMay, B.S., Noda, N., Gladfelter, A.S., et al., 2011. Rapid and quantitative imaging of excitation polarized gluorescence reveals ordered septin dynamics in live yeast. Biophys. J., 101(4):985–994.
Dertinger, T., Colyer, R., Iyer, G., et al., 2009. Fast, background-free, 3D super-resolution optical fluctuation imaging (SOFI). PNAS, 106(52):22287–22292. https://doi.org/10.1073/pnas.0907866106
Dertinger, T., Pallaoro, A., Braun, G., et al., 2013. Advances in superresolution optical fluctuation imaging (SOFI). Q. Rev. Biophys., 46(2):210–221. https://doi.org/10.1017/S0033583513000036
Ding, Y., Xi, P., Ren, Q., 2011. Hacking the optical diffraction limit: review on recent developments of fluorescence nanoscopy. Chin. Sci. Bull., 56(18):1857–1876. https://doi.org/10.1007/s11434-011-4502-3
Dong, S., Liao, J., Guo, K., et al., 2015. Resolution doubling with a reduced number of image acquisitions. Biomed. Opt. Expr., 6(8):2946–2952. https://doi.org/10.1364/BOE.6.002946
Falk, M.M., Lauf, U., 2001. High resolution, fluorescence deconvolution microscopy and tagging with the autofluorescent tracers CFP, GFP, and YFP to study the structural composition of gap junctions in living cells. Microsc. Res. Techn., 52(3):251–262.
Gao, J., Yang, X., Djekidel, M.N., et al., 2016. Developing bioimaging and quantitative methods to study 3D genome. Quant. Biol., 4(2):129–147. https://doi.org/10.1007/s40484-016-0065-2
Geissbuehler, S., Bocchio, N.L., Dellagiacoma, C., et al., 2012. Mapping molecular statistics with balanced superresolution optical fluctuation imaging (bSOFI). Opt. Nanosc., 1(1):1–7. https://doi.org/10.1186/2192-2853-1-4
Gold, R., 1964. An Iterative Unfolding Method for Response Matrices. Argonne National Lab, Lemont, USA.
Gonzalez, R.C., Woods, R.E., 2008. Digital Image Processing. Pearson Education, New York, USA.
Gu, M., Li, X., Cao, Y., 2014. Optical storage arrays: a perspective for future big data storage. Light Sci. Appl., 3(5):e177. https://doi.org/10.1038/lsa.2014.58
Gustafsson, M.G., 2000. Surpassing the lateral resolution limit by a factor of two using structured illumination microscopy. J. Microsc., 198(2):82–87. https://doi.org/10.1046/j.1365-2818.2000.00710.x
Gustafsson, M.G., Shao, L., Carlton, P.M., et al., 2008. Three-dimensional resolution doubling in wide-field fluorescence microscopy by structured illumination. Biophys. J., 94(12):4957–4970. https://doi.org/10.1529/biophysj.107.120345
Hafi, N., Grunwald, M., van den Heuvel, L.S., et al., 2014. Fluorescence nanoscopy by polarization modulation and polarization angle narrowing. Nat. Methods, 11(5):579–584.
Hao, X., Kuang, C., Gu, Z., et al., 2013. From microscopy to nanoscopy via visible light. Light Sci. Appl., 2:e108. https://doi.org/10.1038/lsa.2013.64
Hell, S.W., Wichmann, J., 1994. Breaking the diffraction resolution limit by stimulated emission: stimulatedemission-depletion fluorescence microscopy. Opt. Lett., 19(11):780–782. https://doi.org/10.1364/OL.19.000780
Hess, S.T., Girirajan, T.P., Mason, M.D., 2006. Ultra-high resolution imaging by fluorescence photoactivation localization microscopy. Biophys. J., 91(11):4258–4272. https://doi.org/10.1529/biophysj.106.091116
Hu, Y.S., Nan, X., Sengupta, P., et al., 2013a. Accelerating 3B single-molecule super-resolution microscopy with cloud computing. Nat. Methods, 10(2):96–97.
Hu, Y.S., Zhu, Q., Elkins, K., et al., 2013b. Light-sheet Bayesian microscopy enables deep-cell super-resolution imaging of heterochromatin in live human embryonic stem cells. Opt. Nanosc., 2(1):7. https://doi.org/10.1186/2192-2853-2-7
Huang, B., Babcock, H., Zhuang, X., 2010. Breaking the diffraction barrier: super-resolution imaging of cells. Cell, 143(7):1047–1058. https://doi.org/10.1016/j.cell.2010.12.002
Ingaramo, M., York, A.G., Wawrzusin, P., et al., 2014. Twophoton excitation improves multifocal structured illumination microscopy in thick scattering tissue. PNAS, 111(14):5254–5259. https://doi.org/10.1073/pnas.1314447111
Jansson, P.A., 2014. Deconvolution of Images and Spectra. Courier Corporation, North Chelmsford, USA.
Klar, T.A., Jakobs, S., Dyba, M., et al., 2000. Fluorescence microscopy with diffraction resolution barrier broken by stimulated emission. PNAS, 97(15):8206. https://doi.org/10.1073/pnas.97.15.8206
Lal, A., Shan, C., Xi, P., 2016. Structured illumination microscopy image reconstruction algorithm. IEEE J. Sel. Topics Quant. Electron., 22(4):1–14. https://doi.org/10.1109/JSTQE.2016.2521542
Lazar, J., Bondar, A., Timr, S., et al., 2011. Two-photon polarization microscopy reveals protein structure and function. Nat. Methods, 8(8):684–690.
Li, D., Shao, L., Chen, B.C., et al., 2015. Extended-resolution structured illumination imaging of endocytic and cytoskeletal dynamics. Science, 349(6251):aab3500. https://doi.org/10.1126/science.aab3500
Liu, Y., Ding, Y., Alonas, E., et al., 2012. Achieving λ/10 resolution CW STED nanoscopy with a Ti: sapphire oscillator. PLOS ONE, 7(6):e40003. https://doi.org/10.1371/journal.pone.0040003
McNally, J.G., Karpova, T., Cooper, J., et al., 1999. Three dimensional imaging by deconvolution microscopy. Methods, 19(3):373–385. https://doi.org/10.1006/meth.1999.0873
Mertz, J., 2011. Optical sectioning microscopy with planar or structured illumination. Nat. Methods, 8(10):811–819.
Müller, C.B., Enderlein, J., 2010. Image scanning microscopy. Phys. Rev. Lett., 104(19):198101. https://doi.org/10.1103/PhysRevLett.104.198101
Orieux, F., Sepulveda, E., Loriette, V., et al., 2012. Bayesian estimation for optimized structured illumination microscopy. IEEE Trans. Image Process., 21(2):601–614. https://doi.org/10.1109/TIP.2011.2162741
Pawley, J.B., 2010. Handbook of Biological Confocal Microscopy. Springer, New York.
Qiu, Z., Wilson, R.S., Liu, Y., et al., 2016. Translation microscopy (TRAM) for super-resolution imaging. Sci. Rep., 6:19993. https://doi.org/10.1038/srep19993
Rizzo, M.A., Piston, D.W., 2005. High-contrast imaging of fluorescent protein FRET by fluorescence polarization microscopy. Biophys. J., 88(2):L14–L16. https://doi.org/10.1529/biophysj.104.055442
Rust, M.J., Bates, M., Zhuang, X., 2006. Sub-diffraction-limit imaging by stochastic optical reconstruction microscopy (STORM). Nat. Methods, 3(10):793–796.
Schoonderwoert, V., Dijkstra, R., Luckinavicius, G., et al., 2013. Huygens STED deconvolution increases signal-tonoise and image resolution towards 22 nm. Microsc. Today, 21(6):38–44. https://doi.org/10.1017/S1551929513001089
Schulz, O., Pieper, C., Clever, M., et al., 2013. Resolution doubling in fluorescence microscopy with confocal spinning-disk image scanning microscopy. PNAS, 110(52): 21000–21005. https://doi.org/10.1073/pnas.1315858110
Sheppard, C.J., Mehta, S.B., Heintzmann, R., 2013. Superresolution by image scanning microscopy using pixel reassignment. Opt. Lett., 38(15):2889–2892. https://doi.org/10.1364/OL.38.002889
Sibarita, J.B., 2005. Deconvolution microscopy. In: Microscopy Techniques. Springer-Verlag, Berlin. https://doi.org/10.1007/b102215
Vrabioiu, A.M., Mitchison, T.J., 2006. Structural insights into yeast septin organization from polarized fluorescence microscopy. Nature, 443(7110):466–469. https://doi.org/10.1038/nature05109
Yang, Q., Cao, L., Zhang, H., et al., 2015. Method of lateral image reconstruction in structured illumination microscopy with super resolution. J. Innov. Opt. Health Sci., 9(3):1630002. https://doi.org/10.1142/S1793545816300020
Yang, X., Xie, H., Alonas, E., et al., 2016a. Mirror-enhanced super-resolution microscopy. Light Sci. Appl., 5(6): e16134. https://doi.org/10.1038/lsa.2016.134
Yang, X., Zhanghao, K., Wang, H., et al., 2016b. Versatile application of fluorescent quantum dot labels in superresolution fluorescence microscopy. ACS Photon., 3(9): 1611–1618. https://doi.org/10.1021/acsphotonics.6b00178
Yassif, J., 2012. Quantitative Imaging in Cell Biology. Academic Press, Cambridge, USA.
Yu, W., Ji, Z., Dong, D., et al., 2016. Super-resolution deep imaging with hollow Bessel beam STED microscopy. Laser Photon. Rev., 10(1):147–152. https://doi.org/10.1002/lpor.201500151
Zeng, Z., Chen, X., Wang, H., et al., 2015. Fast superresolution imaging with ultra-high labeling density achieved by joint tagging super-resolution optical fluctuation imaging. Sci. Rep., 5:8359. https://doi.org/10.1038/srep08359
Zhang, X., Chen, X., Zeng, Z., et al., 2015. Development of a reversibly switchable fluorescent protein for superresolution optical fluctuation imaging (SOFI). ACS Nano, 9(3):2659–2667. https://doi.org/10.1021/nn5064387
Zhanghao, K., Chen, L., Wang, M.Y., et al., 2016. Superresolution dipole orientation mapping via polarization demodulation. Light Sci. Appl., 5(10):e16166. https://doi.org/10.1038/lsa.2016.166
Zhou, X., Lei, M., Dan, D., et al., 2016. Image recombination transform algorithm for superresolution structured illumination microscopy. J. Biomed. Opt., 21(9):96009. https://doi.org/10.1117/1.JBO.21.9.096009
Author information
Authors and Affiliations
Corresponding authors
Additional information
Project supported by the National Key Foundation for Exploring Scientific Instrument (No. 2013YQ03065102), the National Basic Research Program (973) of China (No. 2012CB316503), and the National Natural Science Foundation of China (Nos. 31327901, 61475010, 31361163004, and 61428501)
Rights and permissions
About this article
Cite this article
Zeng, Zp., Xie, H., Chen, L. et al. Computational methods in super-resolution microscopy. Frontiers Inf Technol Electronic Eng 18, 1222–1235 (2017). https://doi.org/10.1631/FITEE.1601628
Received:
Accepted:
Published:
Issue Date:
DOI: https://doi.org/10.1631/FITEE.1601628


